Analyzing election results
First, download this .csv file from the New York Times: 2016_election_results_nyt.csv
Step 1: import the CSV into Google Sheets
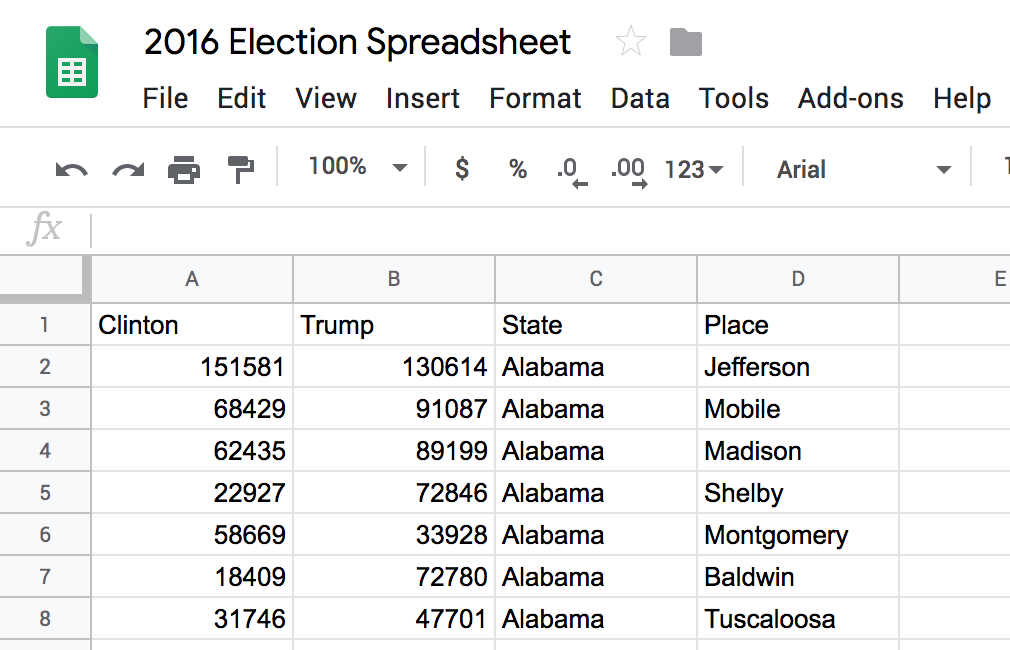
Step 2: move the header row down. Why? Because it’s good practice, showcases proficiency with Google Sheets, and means it’s easier to see what rows you’re in when scrolled down.
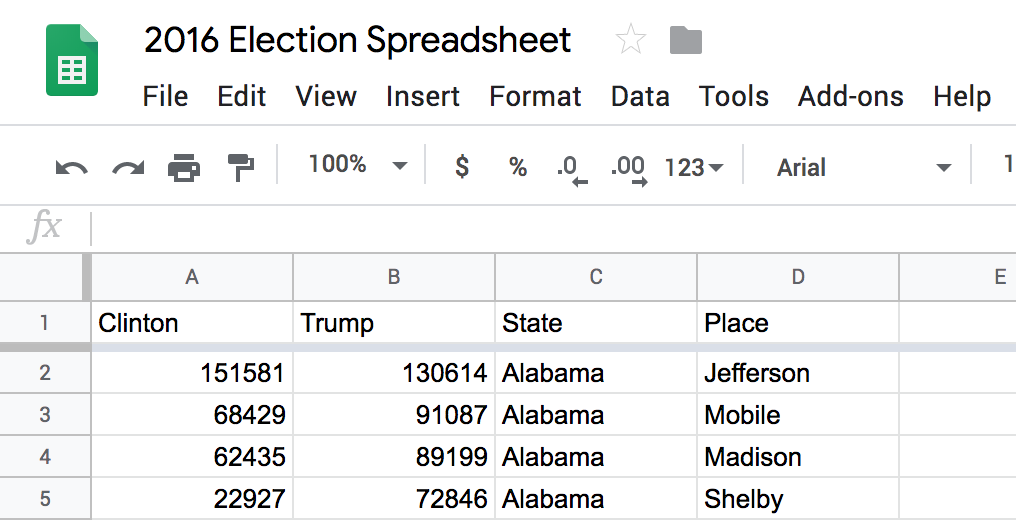
Step 3: click on cell E2. We’re going to do some math to create a new column.

Step 4: type the following into the cell.
=A2+B2

Step 5: press enter to see your newly minted formula compute.

Step 6: we have applied this formula to a single row. Now we want to apply it to all rows. Click on E2 again.

Delicately position the mouse so that the cursor is over the small blue square in the bottom right of cell E2. The cursor should turn into a plus symbol.
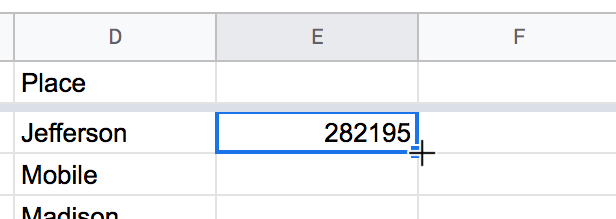
Now, while the cursor looks like the plus symbol, double-click. This will extend the formula to all rows!
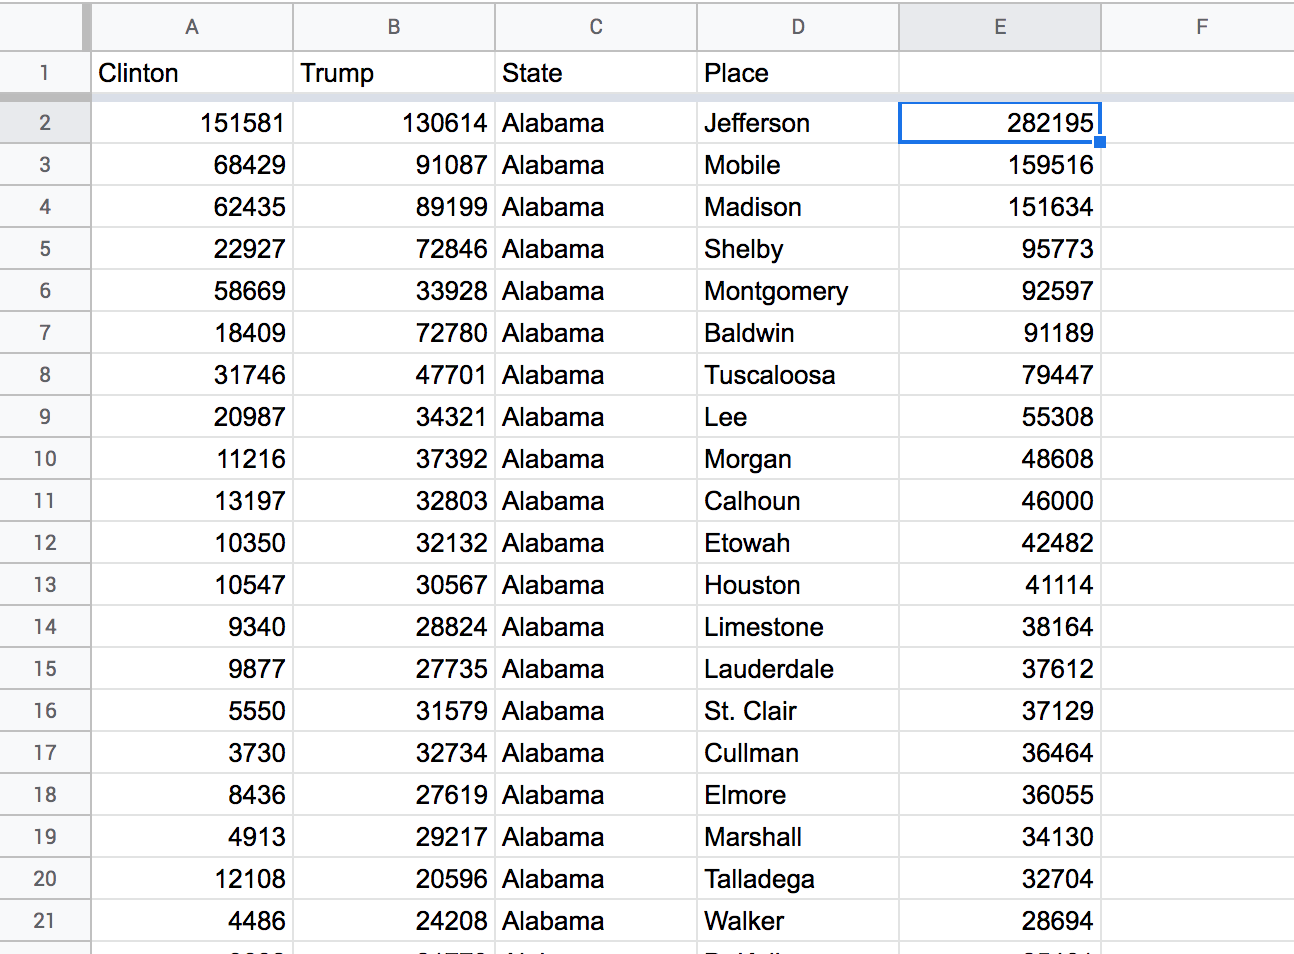
Step 7: click on cell E1 and type to give the header a meaningful name, like “Sum of votes.”

Fun with math
Wow, we’ve just made a formula. It may not seem like much, but we ran an algorithm and applied it to a lot of data at once.
Let’s have some fun with it.
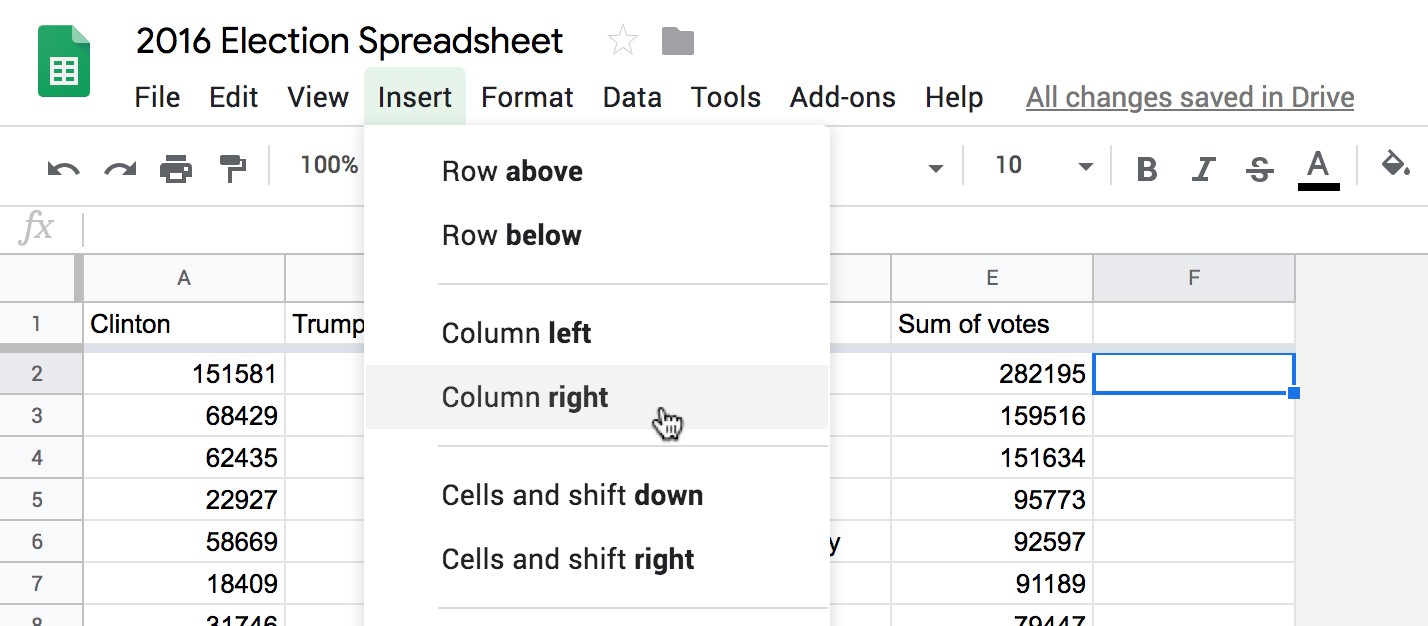
We’re going to create some more columns just like “Sum of votes”. If you need more room in your spreadsheet, select the last column, go to the menu and hit
Insert >
Column Right. This will insert a column to the right of the currently selected one. You can repeat this action multiple times to create more space for yourself.
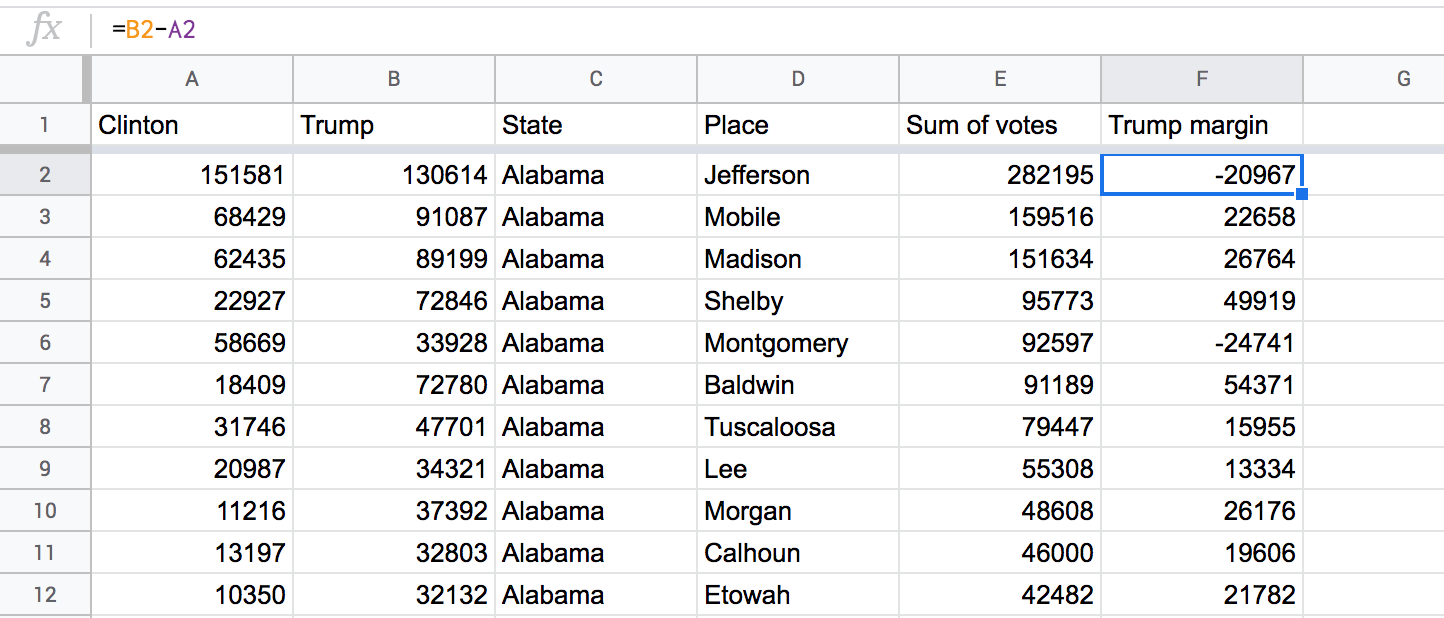
Step 8: click on cell F2 and type the formula
=B2-A2. Note: starting a cell with
= makes it into a formula.

Step 9: following the same instructions as before, compute this formula and apply it to all rows. Then rename the column something like “Trump margin” to show that this column captures how many votes Trump had over Clinton in each place.
Fun with filters
Step 10: let’s see which place had the largest margin of Trump voters. To accomplish this, we are going to sort the Trump margin column. We will create a filter to safely sort the data without altering it.
First, select cell A1 so that Google Sheets knows to filter the right data (if you have a cell selected outside your data, it won’t work).

After selecting cell A1, go into the menu and click
Data >
Create Filter.
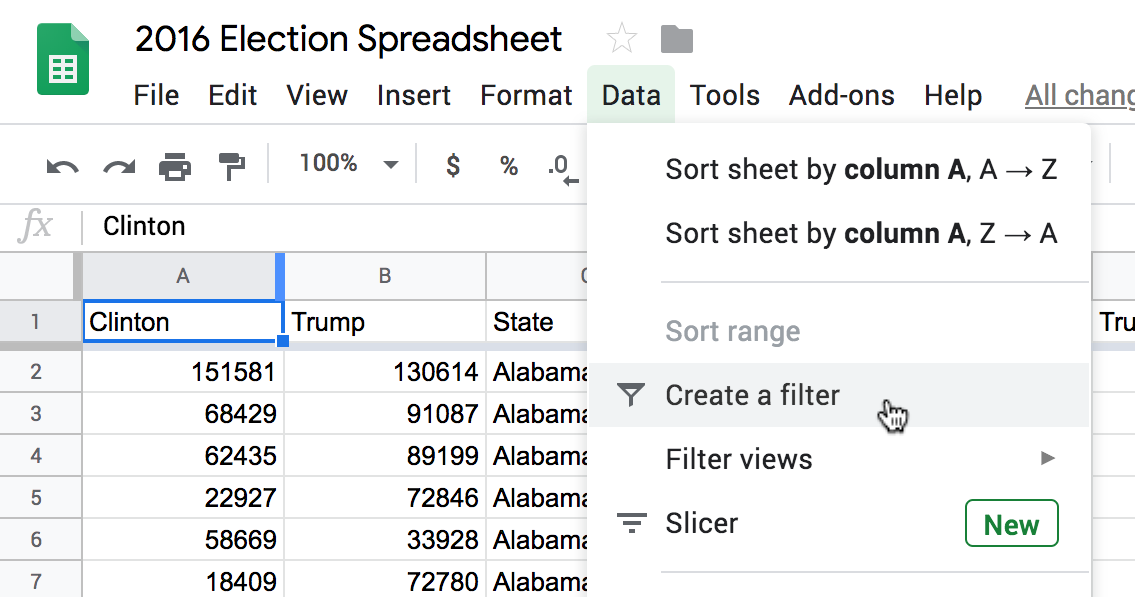
After applying the filter, your spreadsheet should look like a sea of green.
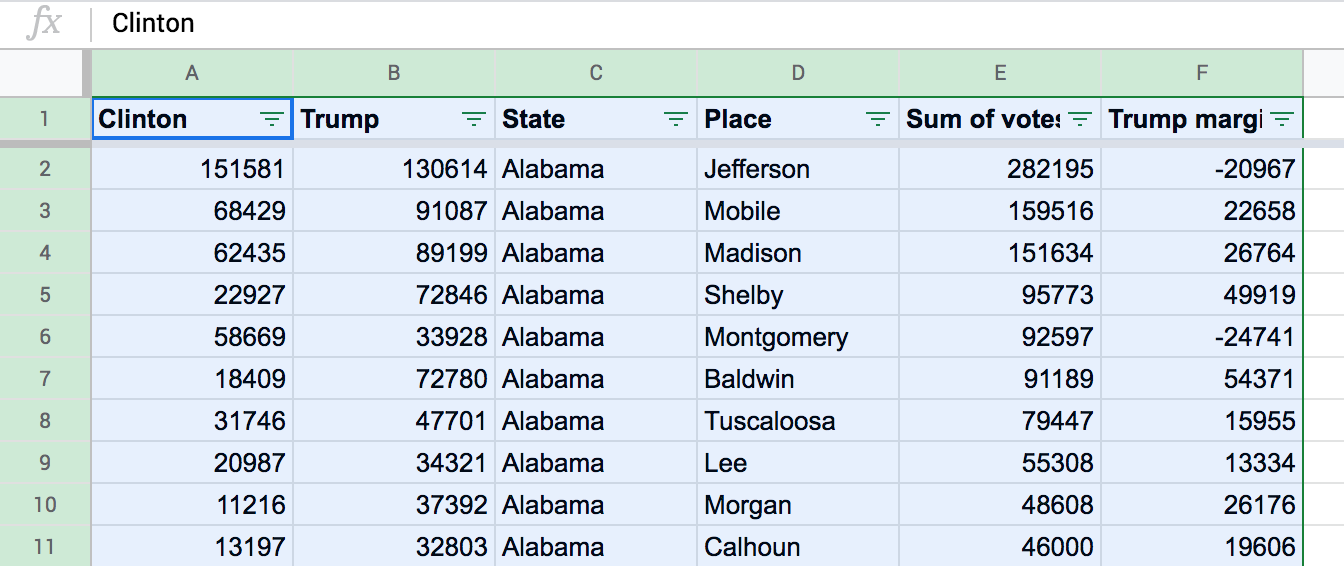
But the cells are all selected too, causing the cells to look blue. Let’s clear the selection to make it easier to work with the data. Click on cell A1 again to erase the selection.

Step 11: now that we’ve created a filter view, the data is green and there’s an icon next to each column that looks like an inverted pyramid. Click on the pyramid icon for the “Trump margin” column.
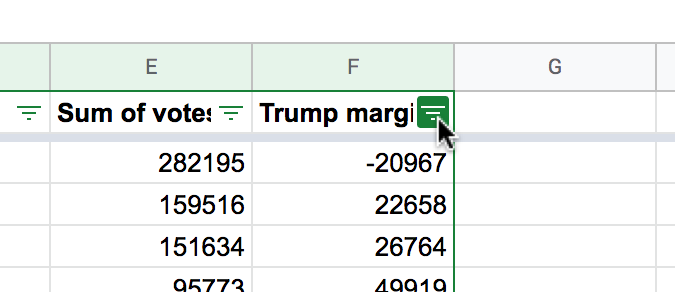
The filter menu should pop up for the “Trump margin” column, showing us its values and sorting options.
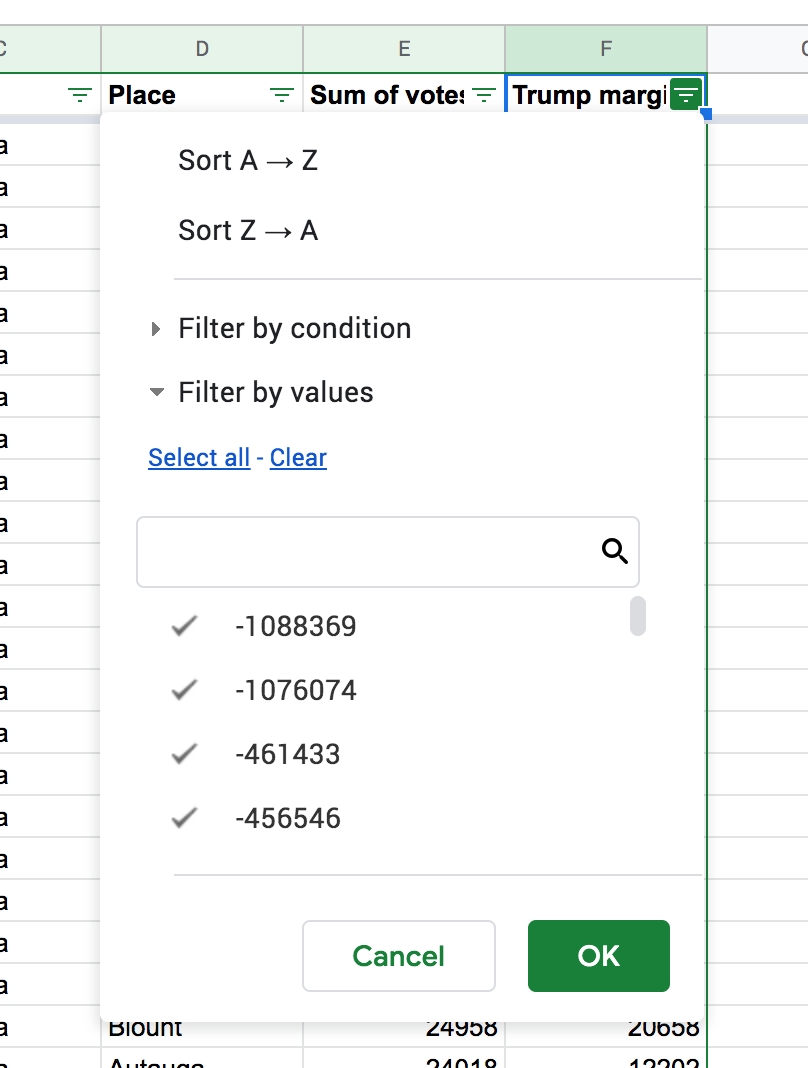
Let’s sort the column to see which county has the largest margin. To sort by largest first, click on
Sort A → Z
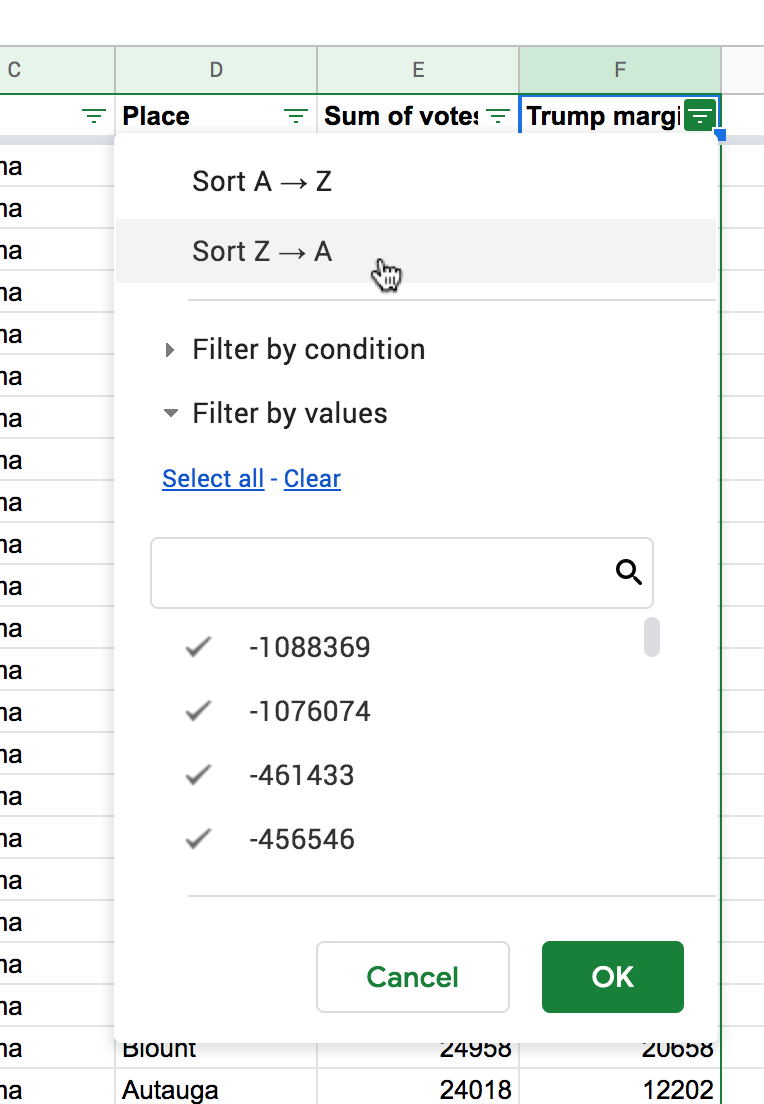
Voila! The results are sorted. And we can see that Montgomery, Texas has the highest margin for Trump.

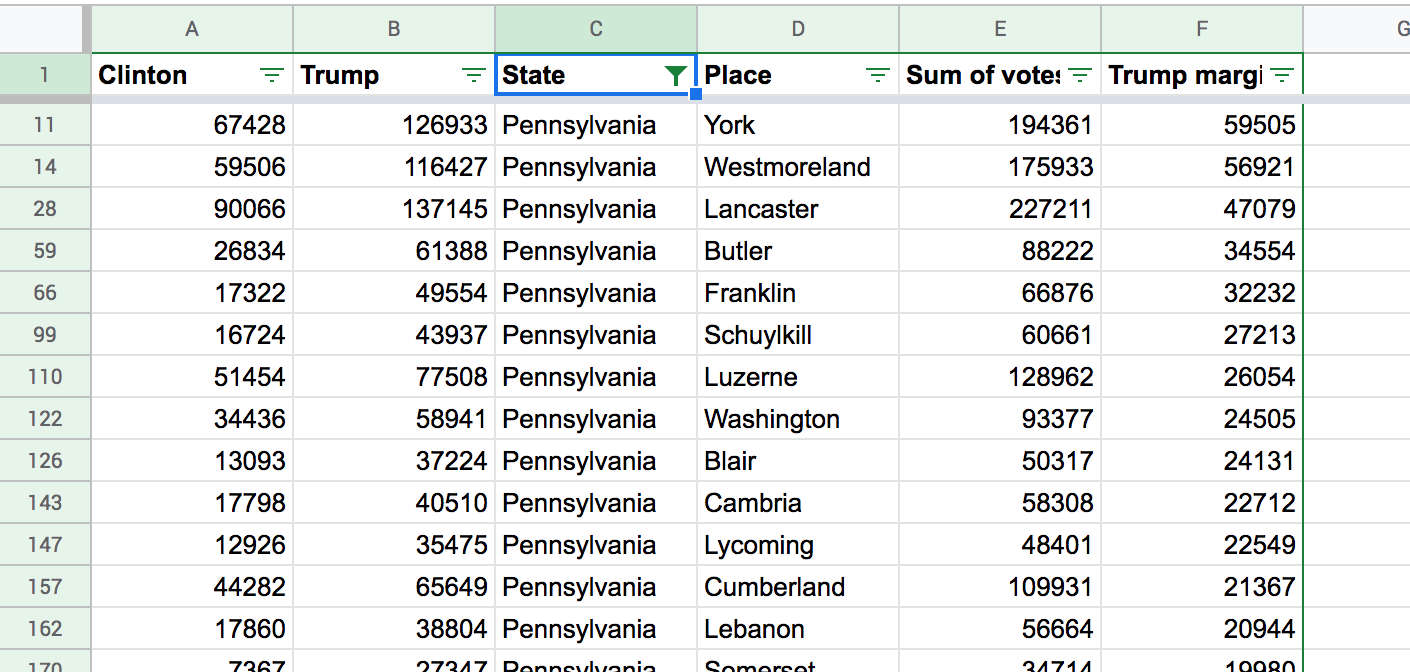
Step 12: We’re in Pennsylvania, so we are interested in data about Pennsylvania. Let’s filter down the state column to only show data for Pennsylvania.
Click the inverted pyramid in the “State” column to open the filter menu for state.
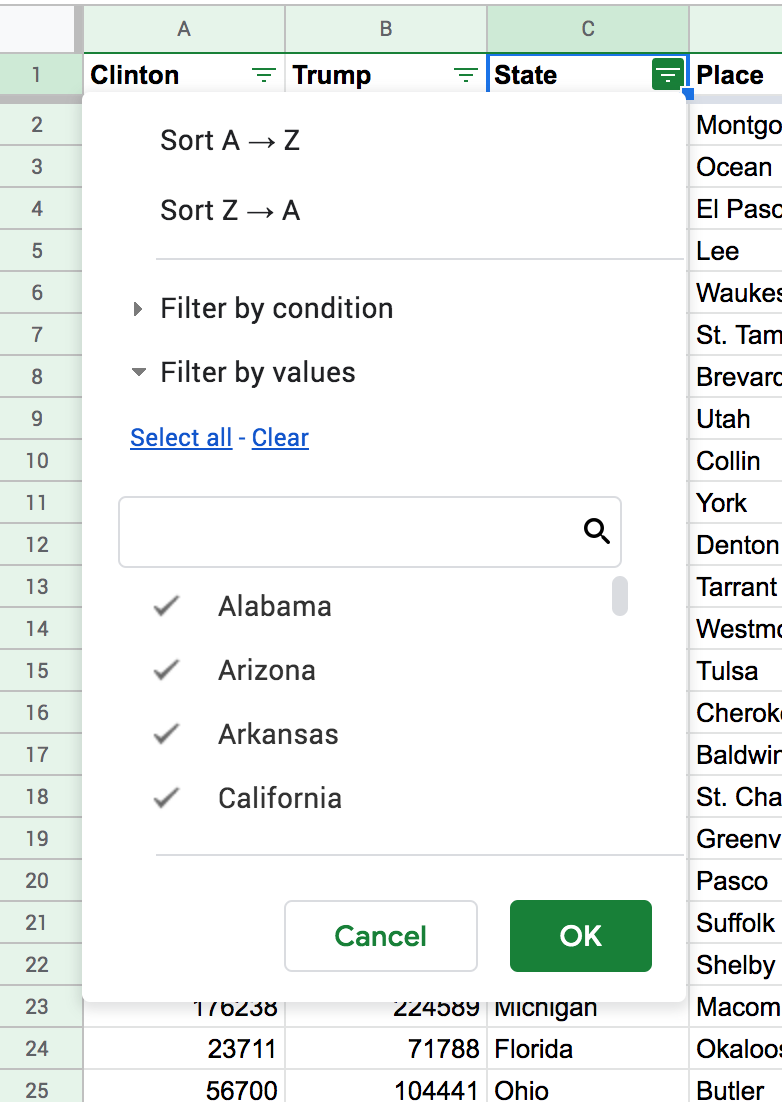
Now we want to only show the state called “Pennsylvania” — the states with checkmarks next to them show all the values that appear in that column. To only show “Pennsylvania” we could manually uncheck all of them except for “Pennsylvania,” but that would take a while. Instead, let’s erase all the states and then add only “Pennsylvania” back in.
Click on the
Clear button to erase the checkmarks next to everything.
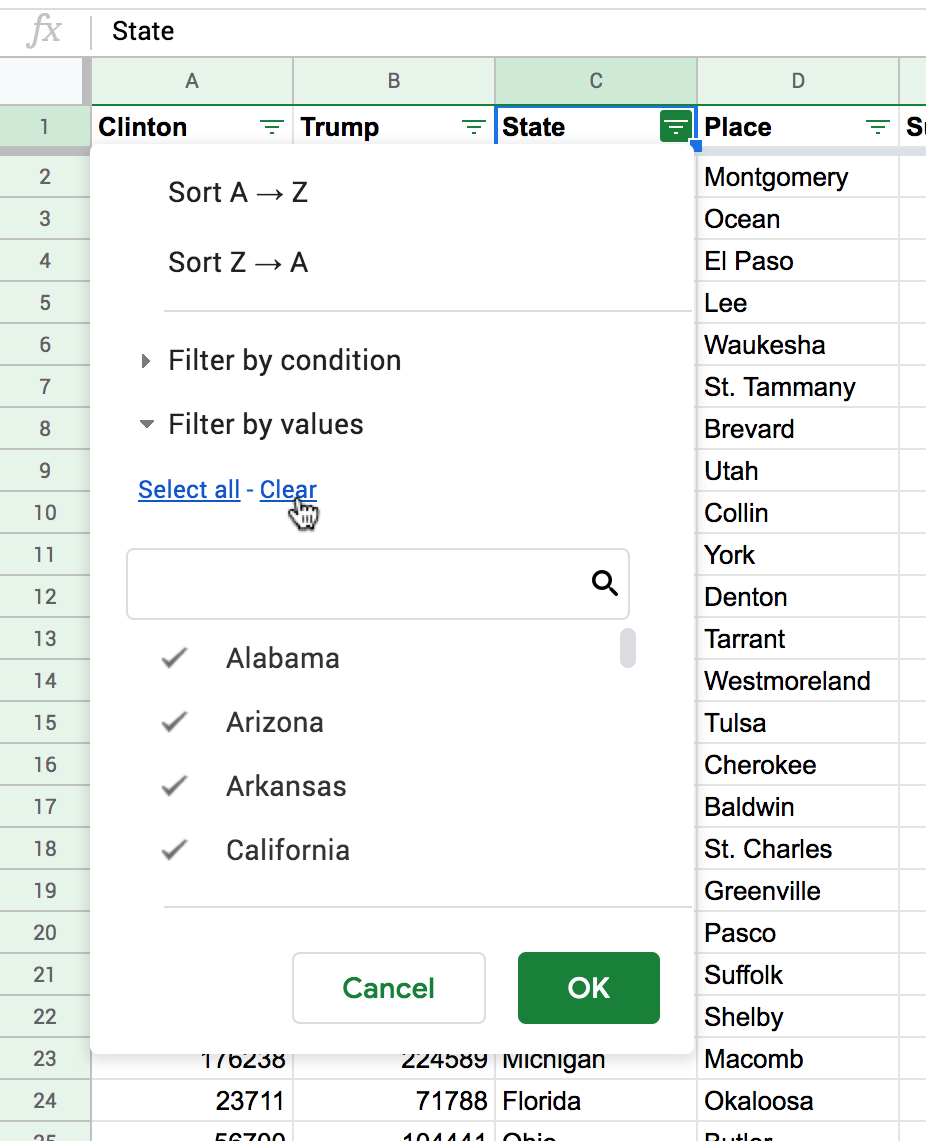
Now, all the state values are unchecked. Let’s find “Pennsylvania.” We could scroll down, or just type “Pennsylvania” into the search box.
As we type, notice the results filter down until all that remains is “Pennsylvania.”
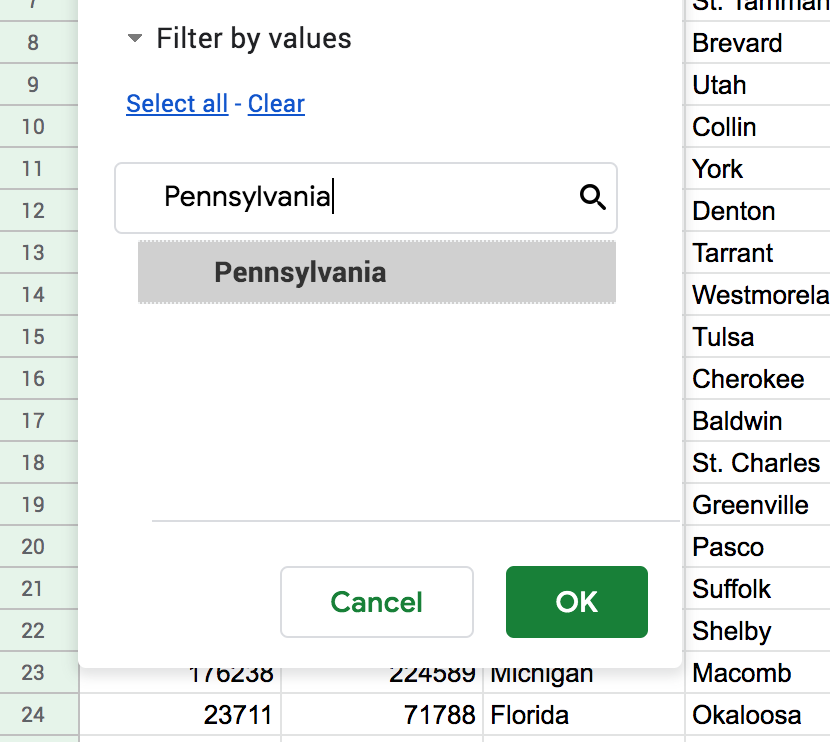
Now, just click on the value for “Pennsylvania” below the search box to cause a check mark to appear.
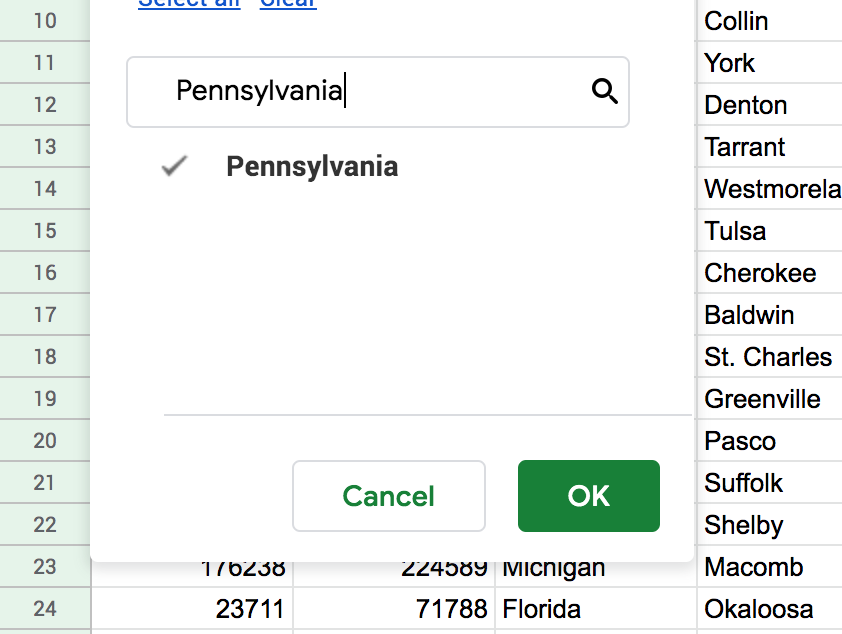
Hit
Ok to apply the filter and see the results.
