
Class 2: Data and Spreadsheets
In this class we’ll explore some public datasets. Then, we’ll learn how to import data into Google Sheets, an online spreadsheet application. Within Google Sheets, we will learn how to sort, filter, analyze, and chart data.
Finding public datasets
While some successful data journalism stories entail collecting data yourself, many utilize public data that can be found on the Internet. Just because data is out in the open does not mean that reporters have found it or covered some aspects of it. Some of the most successful data stories entail finding a new angle into a set of data or combining multiple sources of data in unique ways.
Public datasets about Philadelphia
Ok, let’s try to find public data in Philadelphia. What would an effective Google search for this look like? Try guessing before revealing one example search below:

This Google search follows the structure:
[thing] [place], where
[thing] is a concise way of saying what it is we’re looking for (“public datasets”), and
[place] is “philadelphia” (note that it doesn’t need to capitalized). Words like “in,” “of,” “at,” “to,” etc. can usually safely be omitted from searches since they don’t really change the meaning in Google’s algorithm.
Let’s scan the first page of results for this query. We see
OpenDataPhilly, which claims to contain the official data repository for the city. Scrolling down a little, we see a URL that starts with
data.pa.gov — this seems more reputable, since
.gov URLs have to be registered by the government and can’t be made up by random people. Clicking on this government source yields a link to
OpenDataPhilly. Yay, we’ve verified it’s legit. Now let’s see what we can find on it.
OpenDataPhilly
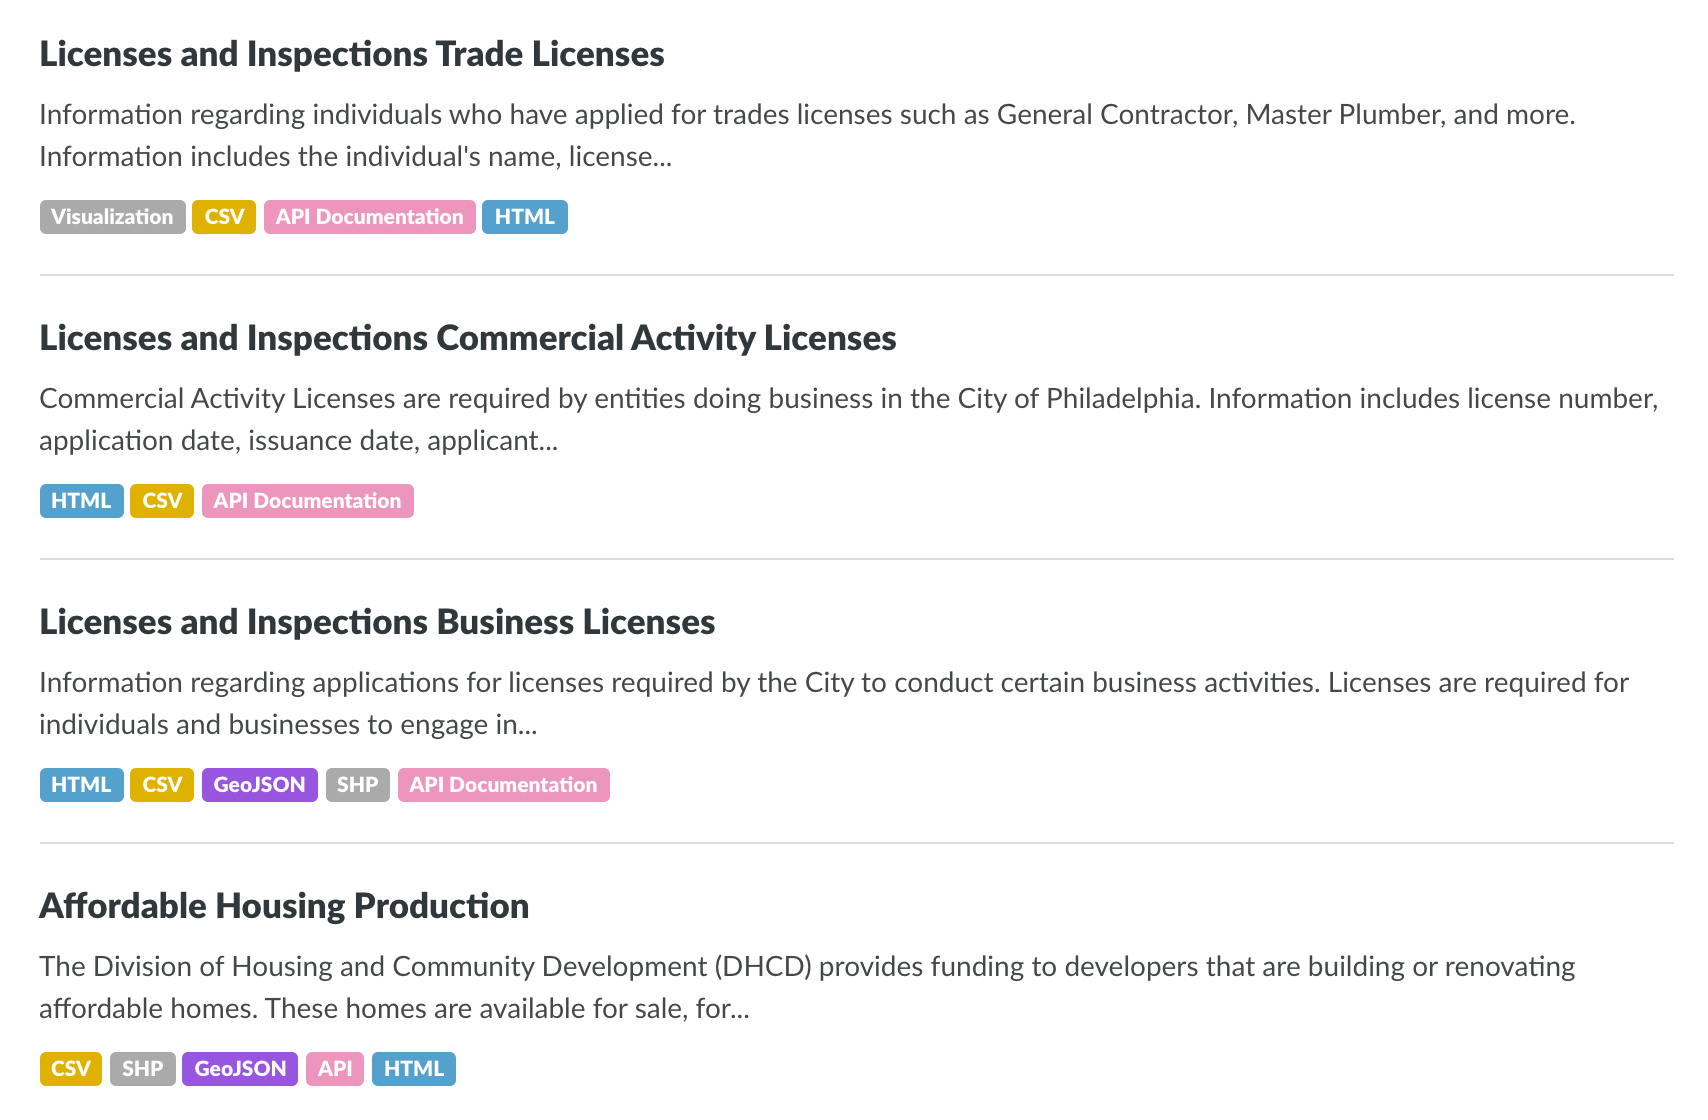
After clicking the
Datasets link in OpenDataPhilly (or one of the categories below), we see a listing of datasets. Each dataset contains several mysterious, colorful tags below, like
Visualization,
CSV,
HTML,
GeoJSON,
SHP, or
API Documentation, among others. What do these mean?
Visualization and
HTML are more obvious, but the shorter acronyms are cryptic.
My first line of attack for learning about what these tags might mean would be to search the website in question, in this case, the
About or
FAQ page on OpenDataPhilly. Unfortunately, they are not helpful here. It’s just assumed that we must know what these tags mean, since everyone that uses the website is obviously a proficient data scientist... Let’s turn to Google:
In this Google search, we’re asking Google a question, “what is [thing]” — since Google is trained to answer questions, we often get direct results for this kind of thing.
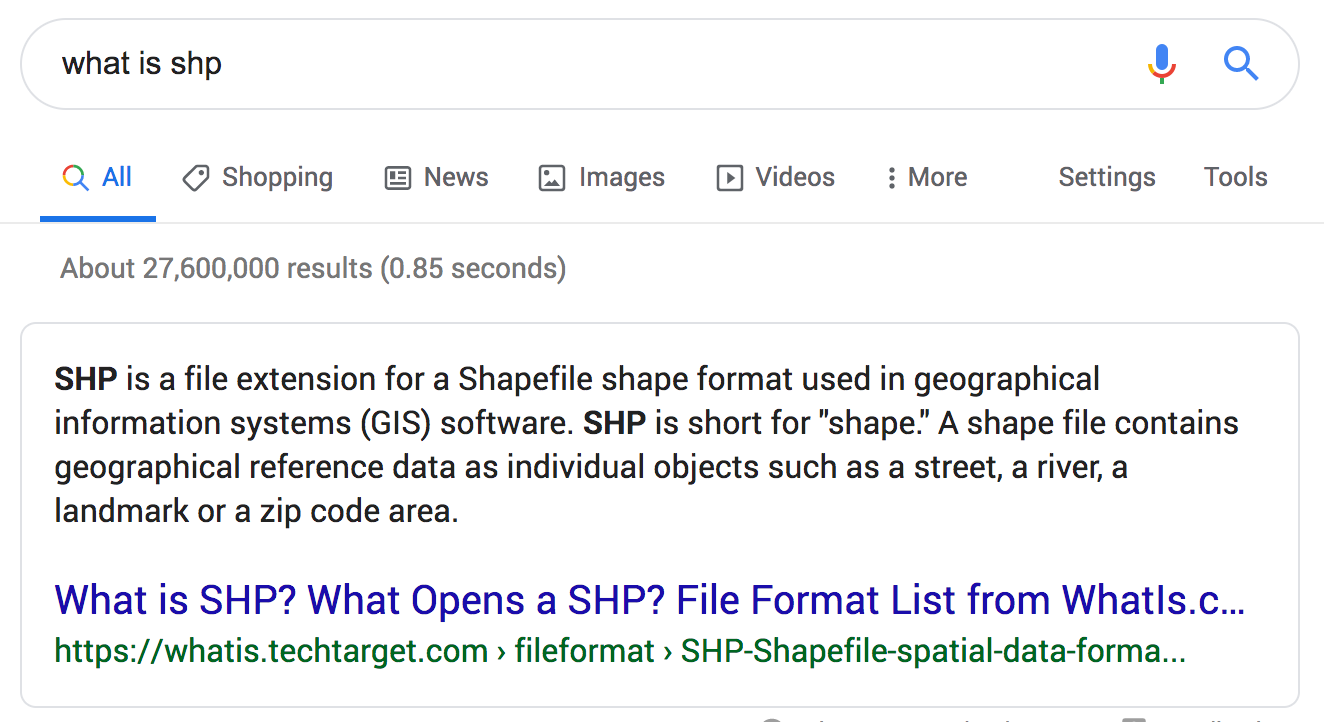
For example, the query
what is shp reveals a “knowledge panel,” that little card that shows up before the search results. This displays a concise definition. In this case, it’s pretty helpful. But sometimes, Google gets it wrong, in which case it’s good to scan the search results and look for sites we know are probably reputable, like
Wikipedia.
It’s also good to note that we’re searching for acronyms that may have multiple meanings. We’re particularly searching for these acronyms as they relate to data, but we haven’t told Google that. It’s good to first see what Google returns without telling it you’re looking for data-specific results, just to see if it’s an obvious thing. If the Google results don’t really fit the bill, append the keyword
data to the end of the search to give Google the hint.
Data formats
To summarize, the Google searches about these tags should reveal that most of them are data formats — essentially, filetypes that describe data. Once you figure out they’re data formats, you may start Google searching
[name] data format, like “geojson data format,” to get more relevant results. I’ve provided brief definitions for the common ones
here.
This week we will focus only on
tabular data formats. These formats describe spreadsheet data with rows and columns. The two main tabular data formats are
csv and
xls/xlsx. The former stands for “comma-separated values” — this file contains a list of lines corresponding to rows, with each line containing a list of values separated by commas (these correspond to columns). The latter format describes Microsoft Excel spreadsheets. This format is more flexible than CSV, allowing for multiple
sheets within the same file (pages of data, if you will) as well as formatting, but it isn’t as simple.
Both kinds of files can be imported into Google Sheets, but OpenDataPhilly has lots of datasets tagged CSV, so let’s look at some of those.
Exploring datasets
I randomly selected the following dataset which has a CSV tag: School District of Philadelphia: Full Time Employee (FTE) .
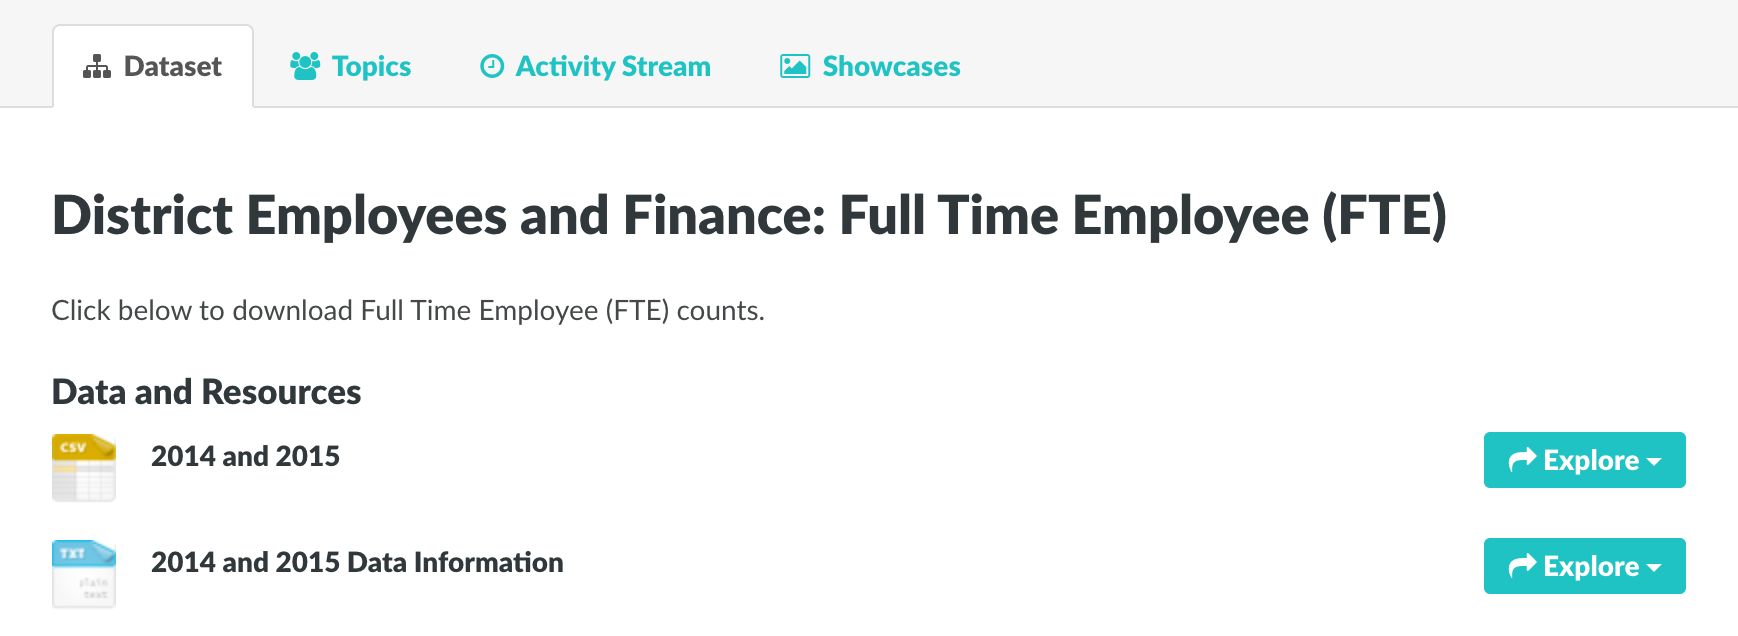
Now, we see the data associated with this dataset. Notice that there is a CSV file and a TXT file. We want to download the CSV file so that we can import it into Google Sheets. Click the
Explore button next to the CSV file and click
Download. Save the file somewhere on your computer where you can find it later.
Importing into Google Sheets
Visit Google Sheets at sheets.google.com. Log into your Google account if you haven’t already.
Now, following the video below to see how to import:
Instructions:
Get started by creating a new spreadsheet (hit the big ‘+’ button on the home page of Google Sheets after logging in). Once the spreadsheet pops up and is no longer loading (the “Working...” box stops showing), go to the menu and click on
File >
Import. On the import dialog, click on the
Upload tag and then drag the CSV file you downloaded into the box or click to select the file from your computer. Once the file uploads, an “Import file” dialog will show with several parameters. Under
Import location, you can set it to “Replace spreadsheet” since you just have an empty spreadsheet anyways. You can leave the default settings for
Separator type and
Convert text to numbers, dates, and formulas since those usually work pretty well. Click on the “Import Data” button to start the import. After a few moments, your data should pop up.
Now, place your mouse over the thicker gray line above the first row to the left of the first column. Click and drag your mouse down to pull that line in between the first and second row. This lets Google Sheets know that the first row is a header.
Awesome, we’ve imported our sheet. Now... what do all these columns mean?
Finding the metadata
Metadata is data about a dataset. In this case, metadata would be data that describes the column layout of the full-time employee data. Usually, the best place to find the metadata for a dataset is where the dataset itself was found.
Remember, there was a TXT file that showed up with the full-time employee dataset page. This format, like it sounds, just contains simple text. Maybe it’s our metadata. Let’s click through to check.
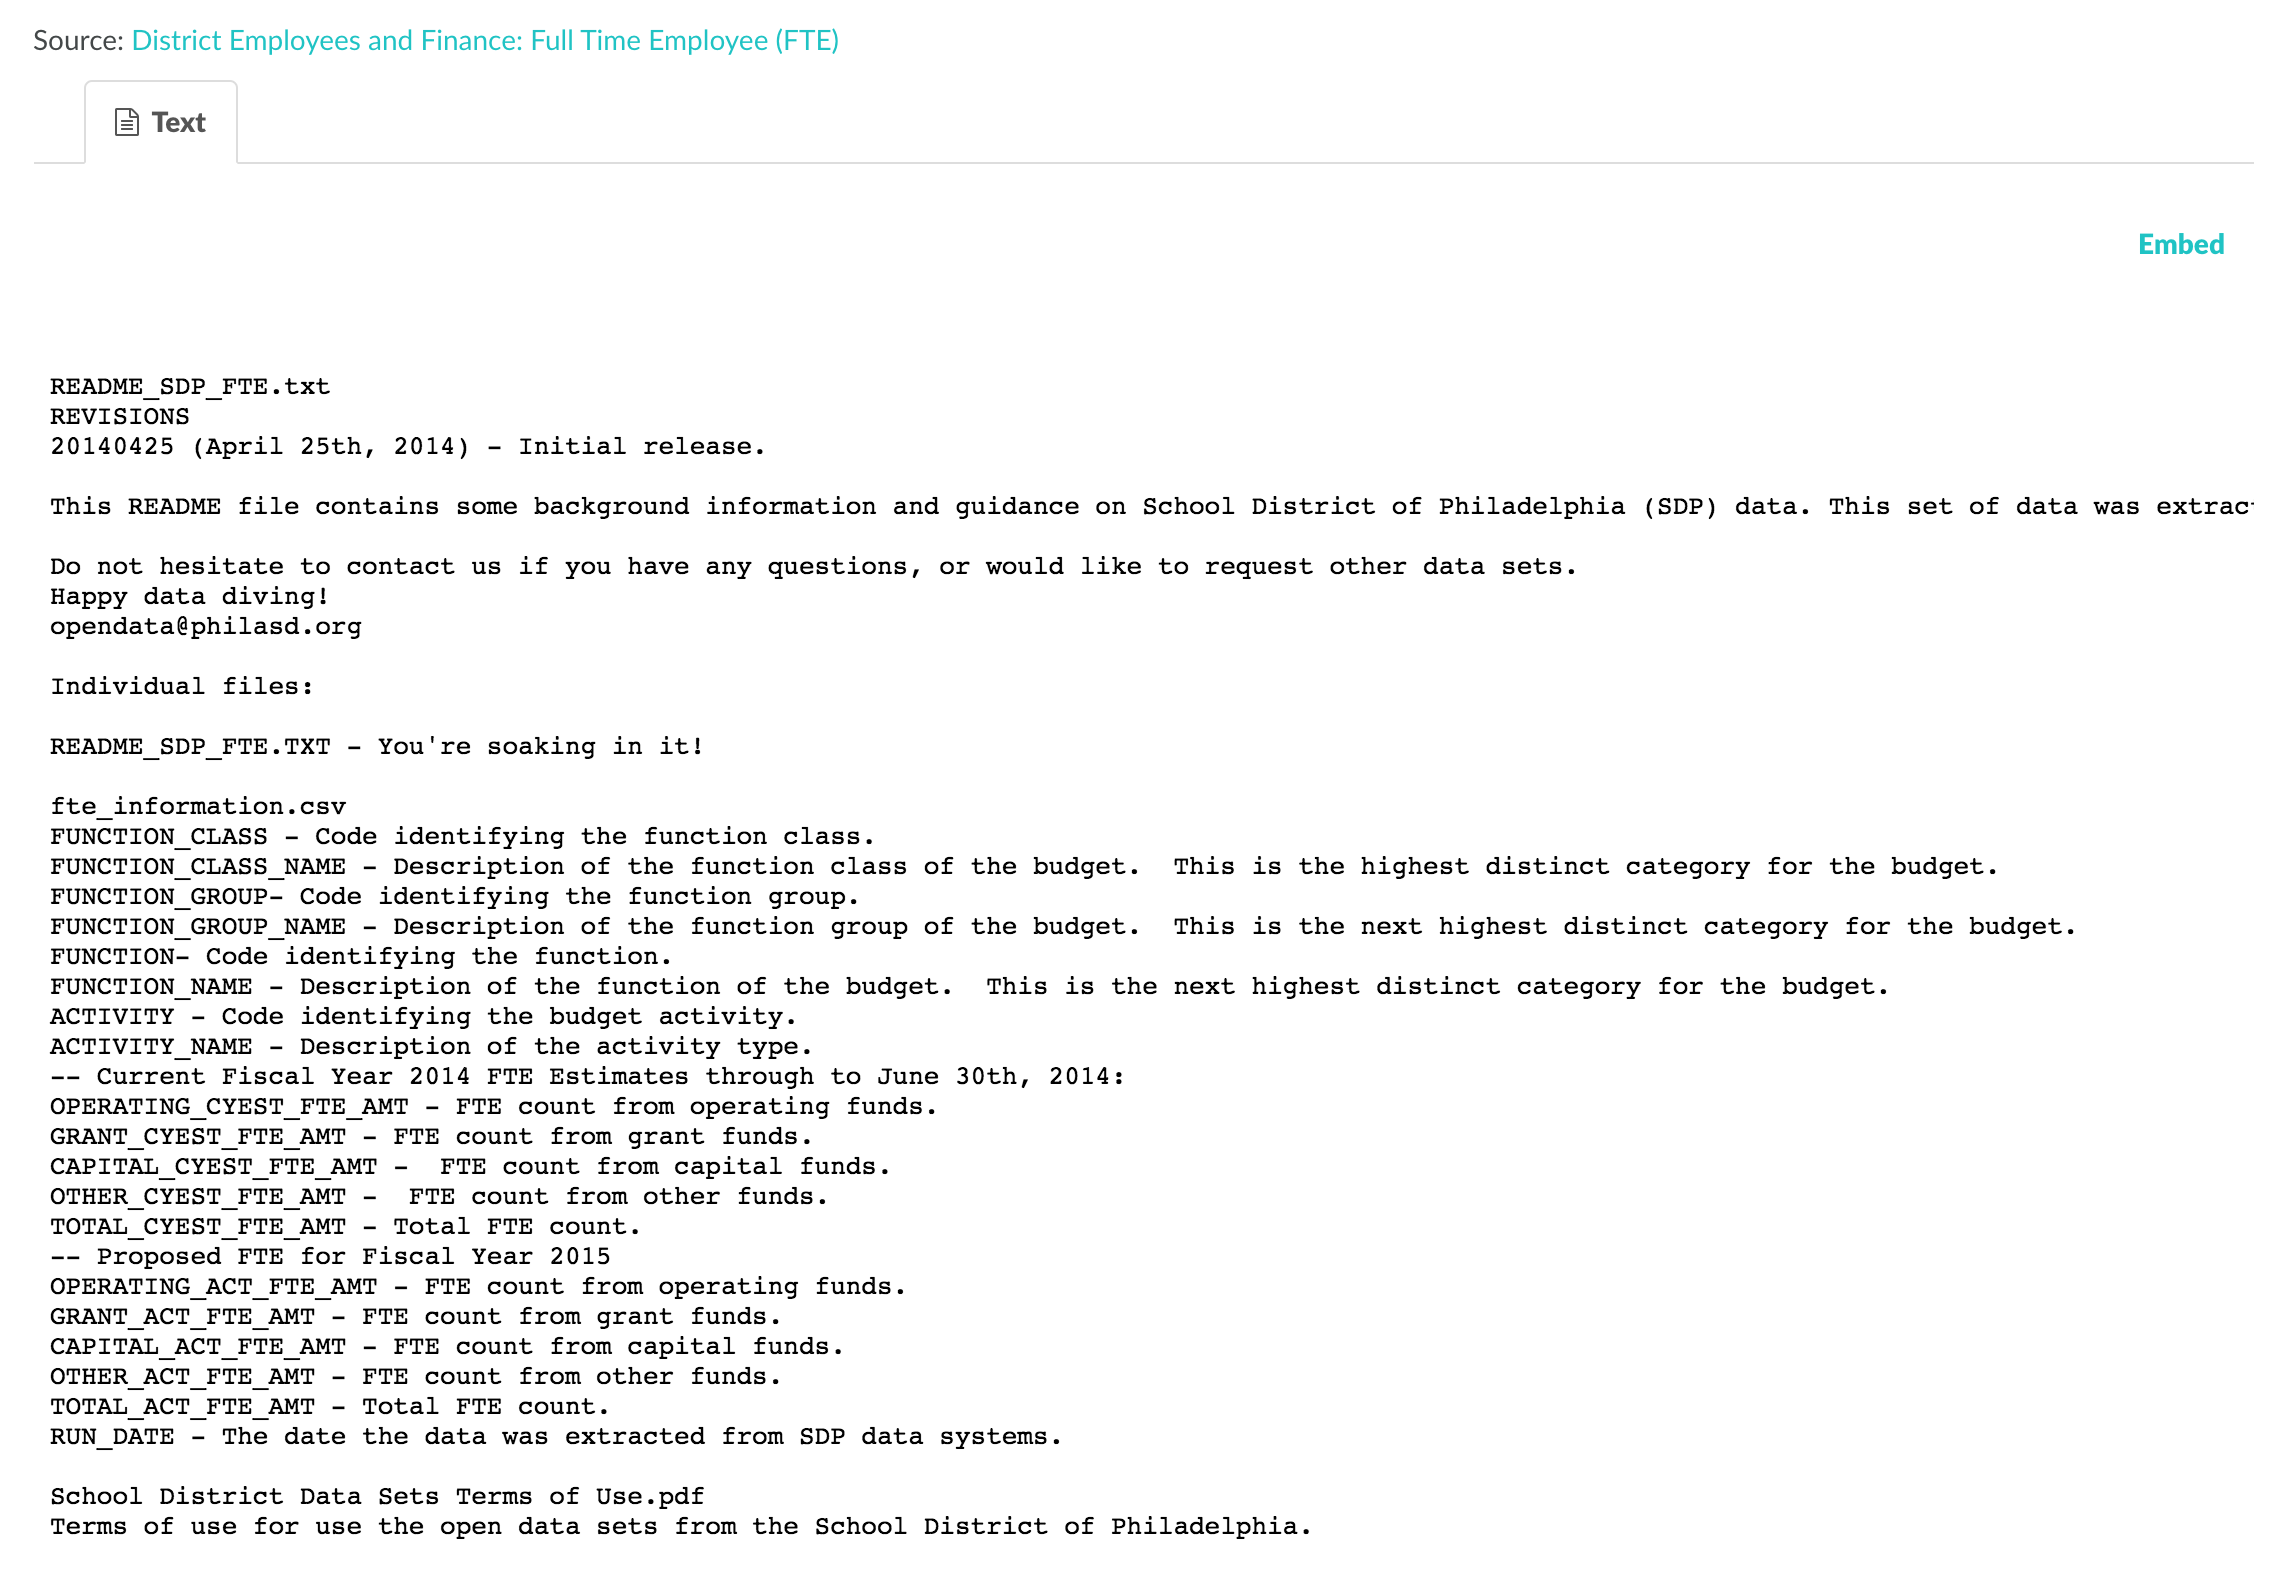
Bingo! Now we can understand what’s going on. Let’s play around with the data in class. You can find more videos of spreadsheet tips corresponding to the lecture on this page.