The Final Project
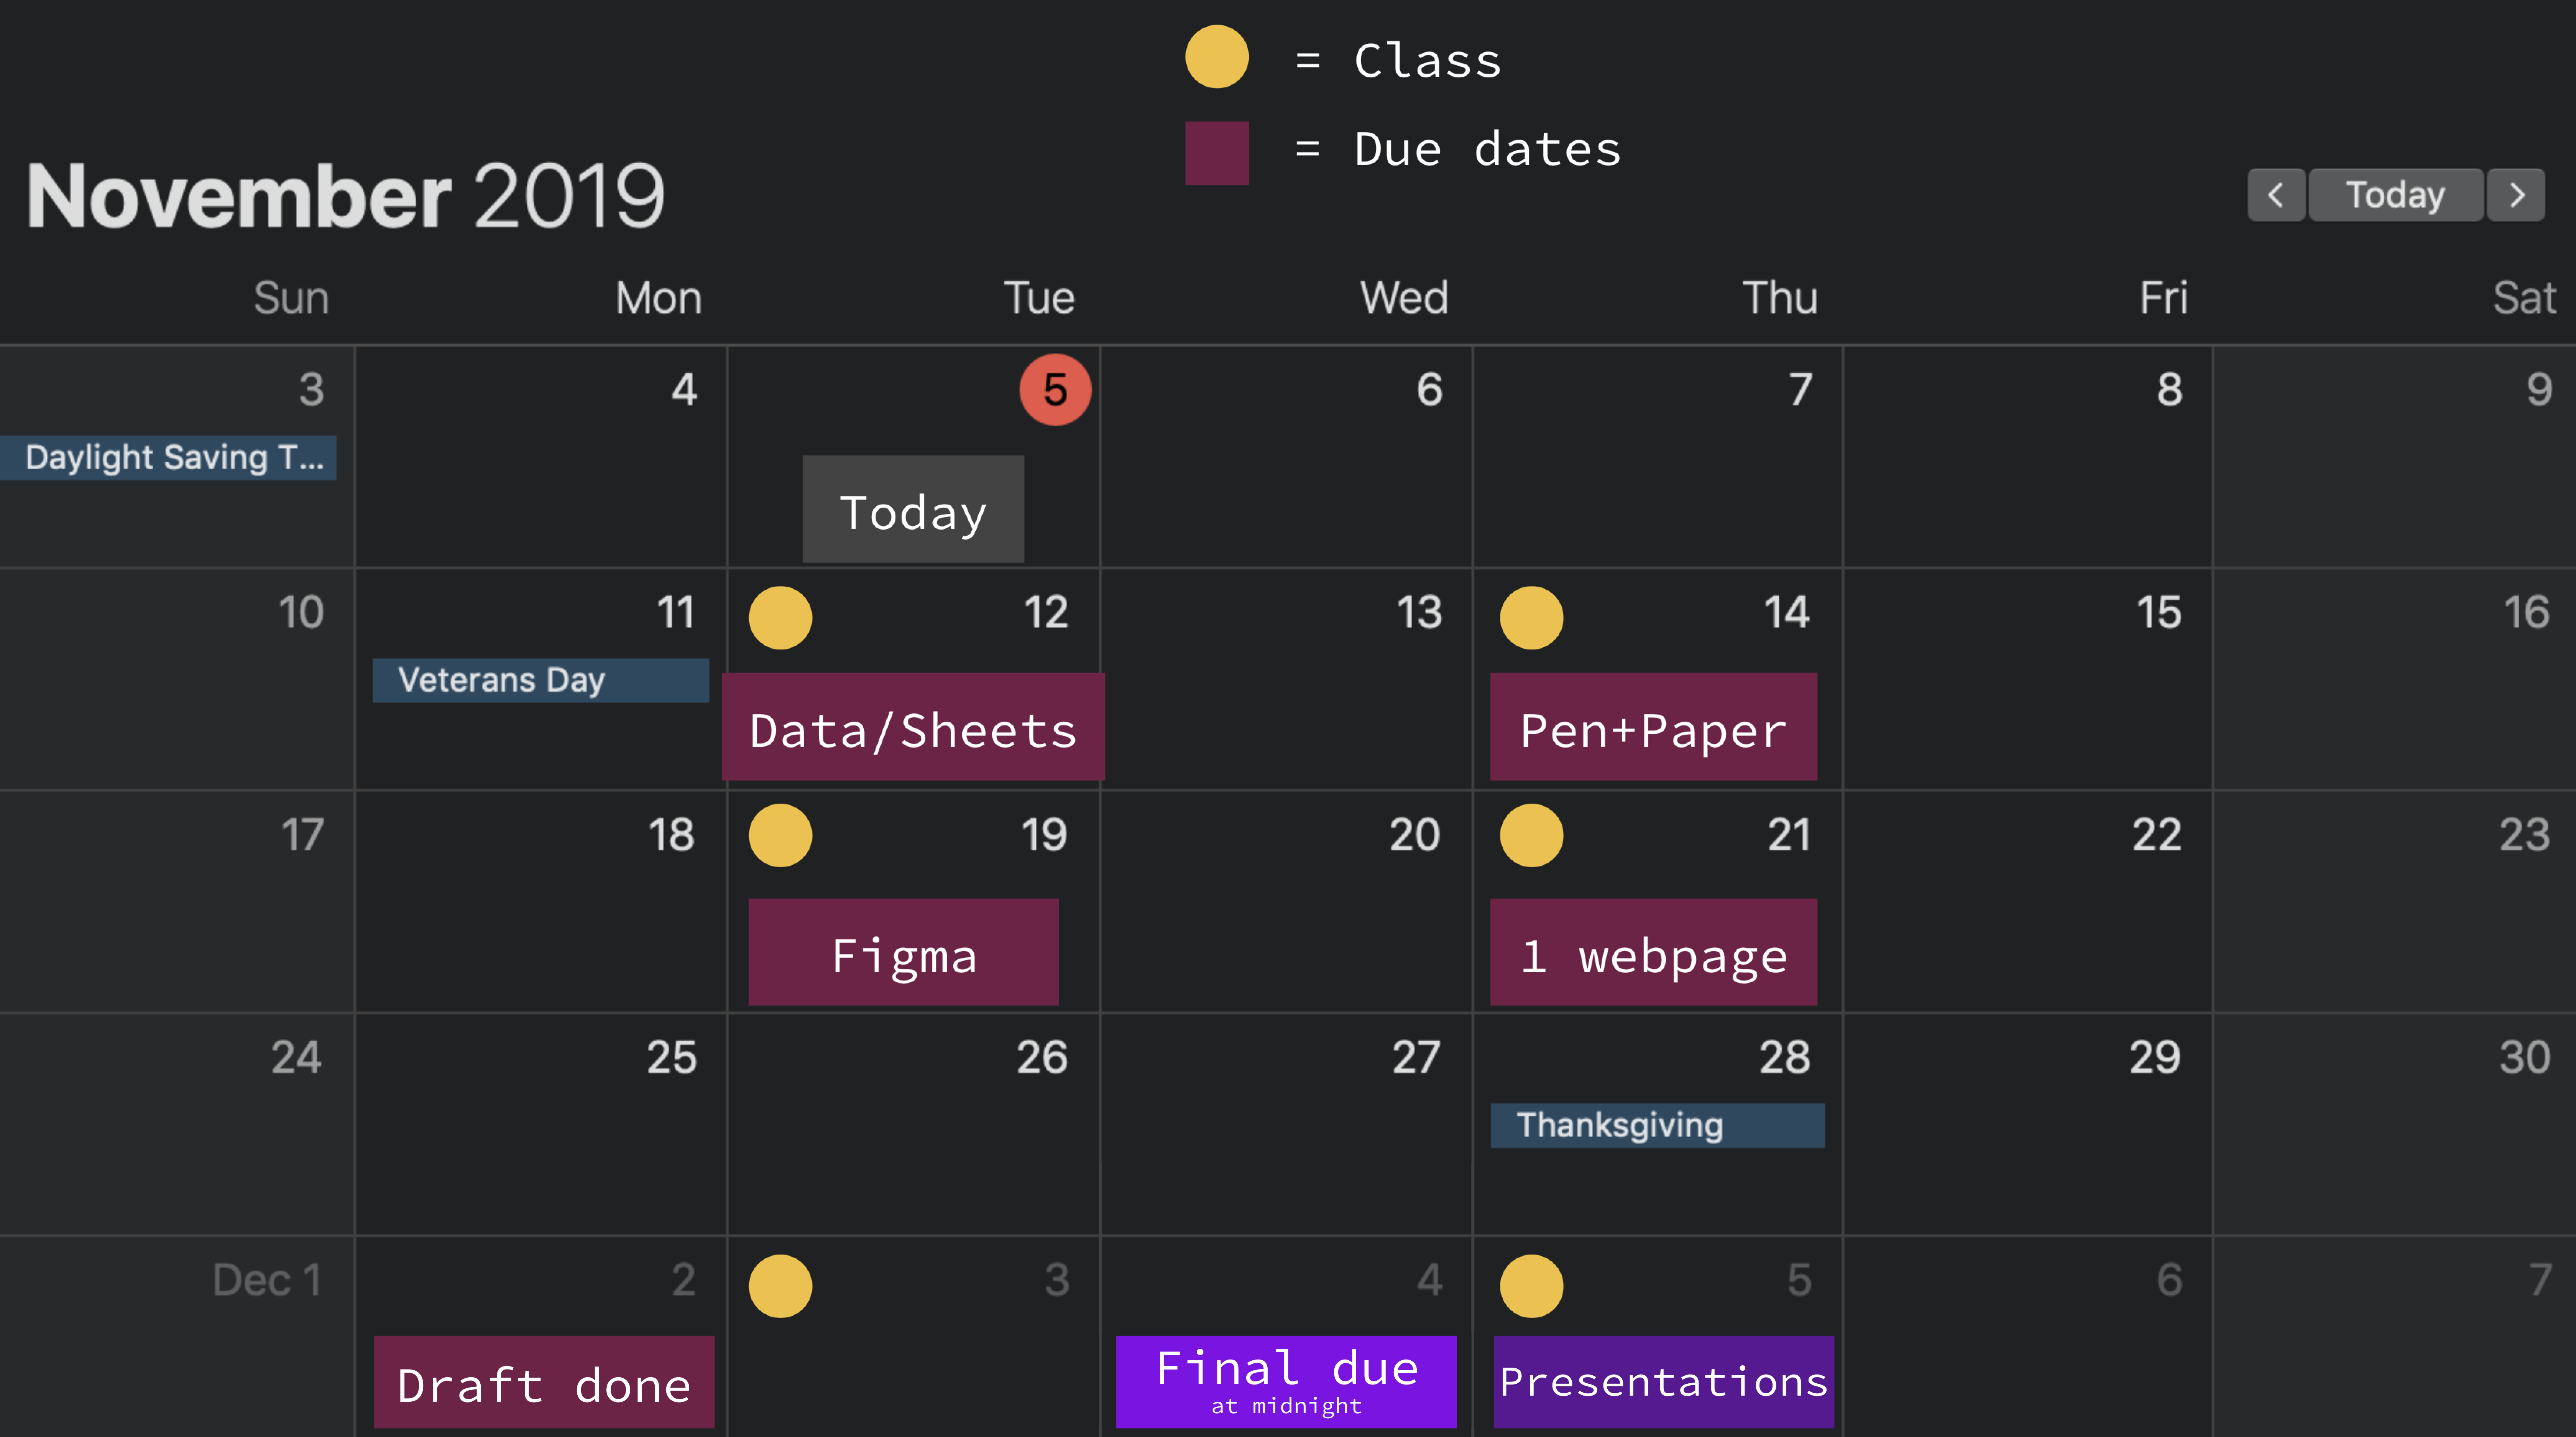
The final is due by end of day Wednesday, December 4th. (Try to have a draft done by Monday, December 2nd. Tuesday will mostly be in-class time to clean up the project and get individual feedback, and I will make myself available on Wednesday for help as needed.
The final project is essentially to create a website with multiple pages that presents a real story about data. For this final project, original reporting is less important than being able to take existing data, assemble it in useful and interesting ways, and present it to the web.

We will divide the final project into three components: data, graphics, and web.
Data
In the data section, you will find data relevant to your beat, which many of you have done already. Slice up the data in interesting ways using the techniques we’ve covered in class and create a few sample charts.
The data section has the following requirements:
- Find one or more datasets that are relevant to your beat
- Filter, pivot, extract interesting insights about the data
- Create a few charts in Google Sheets
Graphics
In the graphics section, you will put your design hats on. First, mock up a website design with your charts using pen/pencil and paper (old technology rules). Then, try to recreate it in Figma to some degree and figure out your colors, styles, and fonts.
The graphics section has the following requirements:
- Create a mock of your entire website in pen and paper. This mock should contain each page on your site with some example visualizations on each page.
- Render some frames in Figma to capture your website’s look and feel. You should have a frame for each page in your site. And you should figure out here what styles your website will roughly have. Simple and minimalistic is ok, but be deliberate with your design choices.
Web
In the web section, you will pull out your WebWarrior skills and create the pages of your website.
The website needs to fit the following requirements:
- Have at least 3 pages all interlinked
- Have a consistent and unique style with a custom font
- Present at least two visualizations
- Present nice write-ups of the significance of your data
- Present nice write-ups on the process of collecting the data and putting the project together (could be on an About or Behind-the-Scenes page)
Timeline
We will break the final project into concrete milestones to keep everyone on track.
- Tues Nov 12: be finished with data and spreadsheet component of the project
- Thurs Nov 14: complete a pen and paper mock of the website and visualizations
- Tues Nov 19: finish some Figma mock-ups of your website and visualizations
- Thurs Nov 21: finish the first page of your website
- Mon Dec 2: try to have a draft done of the final project website. I will be available for help and feedback in class on Tuesday.
- Wed Dec 4: the final project is due at midnight! I will make myself available during the day for any last-minute help
- Thurs Dec 5: final project presentations! Everyone will present in some depth about their final projects, and we’ll all have a good time
Grading
The final projects will be graded on a 100-point scale, and the project will account for 40% of your overall class grade.
Here’s a breakdown
- 1/4 of the grade will be on your data: did you analyze it with pivots and filters, extract insights, clean it up properly, create compelling example charts in Google Sheets
- 1/4 of the grade will be on your graphics component: your mocks don’t have to exactly capture the final website, but they should be thorough and inform your design decisions later on. Try to design intentionally, making use of the principles we covered earlier
- 1/4 of the grade will be on your website: do you hyperlink things properly, including at least a few styles, embed visualizations with your site
- The last 1/4 of your grade will be on the overall experience: do you tell a compelling tale with the data? Do your design decisions complement the raw data? Is the website easy to use?
- There will be extra credit available for students who go above and beyond, e.g. use lots of CSS styles, create interactives with buttons, uncover unique/newsworthy data insights, tell a large/comprehensive story, put extra effort into the presentation


