Class 20: Basic Embedding
In this class we’ll learn about embedding, which just means putting content from somewhere else on the web inside your webpage. As fun as it is to manually create each
<div> of a bar chart manually, embedding lets you find and utilize visualization tools on the web that do all the work for you.
Useful embedding tools
- YouTube: Go to any YouTube video, click on “Share” and then “Embed.”
- Google Sheets: Create a chart somewhere on your page, then go to File > Publish to Web. Select Embed and then instead of “Entire Document,” click on that to get a dropdown where you can just select your visualization title.
- DataWrapper: Go to the website and click to create a new chart. You can link up Google Sheets or input data in another way. Then you can go through some intuitive menus to design your own visualization. At the end, you will have the option to generate an embed code (it will make you sign up for an account first).
How to embed once you have the code
For this example, let’s embed something with YouTube. Go to any YouTube video, then click Share > Embed and copy the code that’s presented to you.
In my example, Data journalists are the new punks, we get this embed code returned:
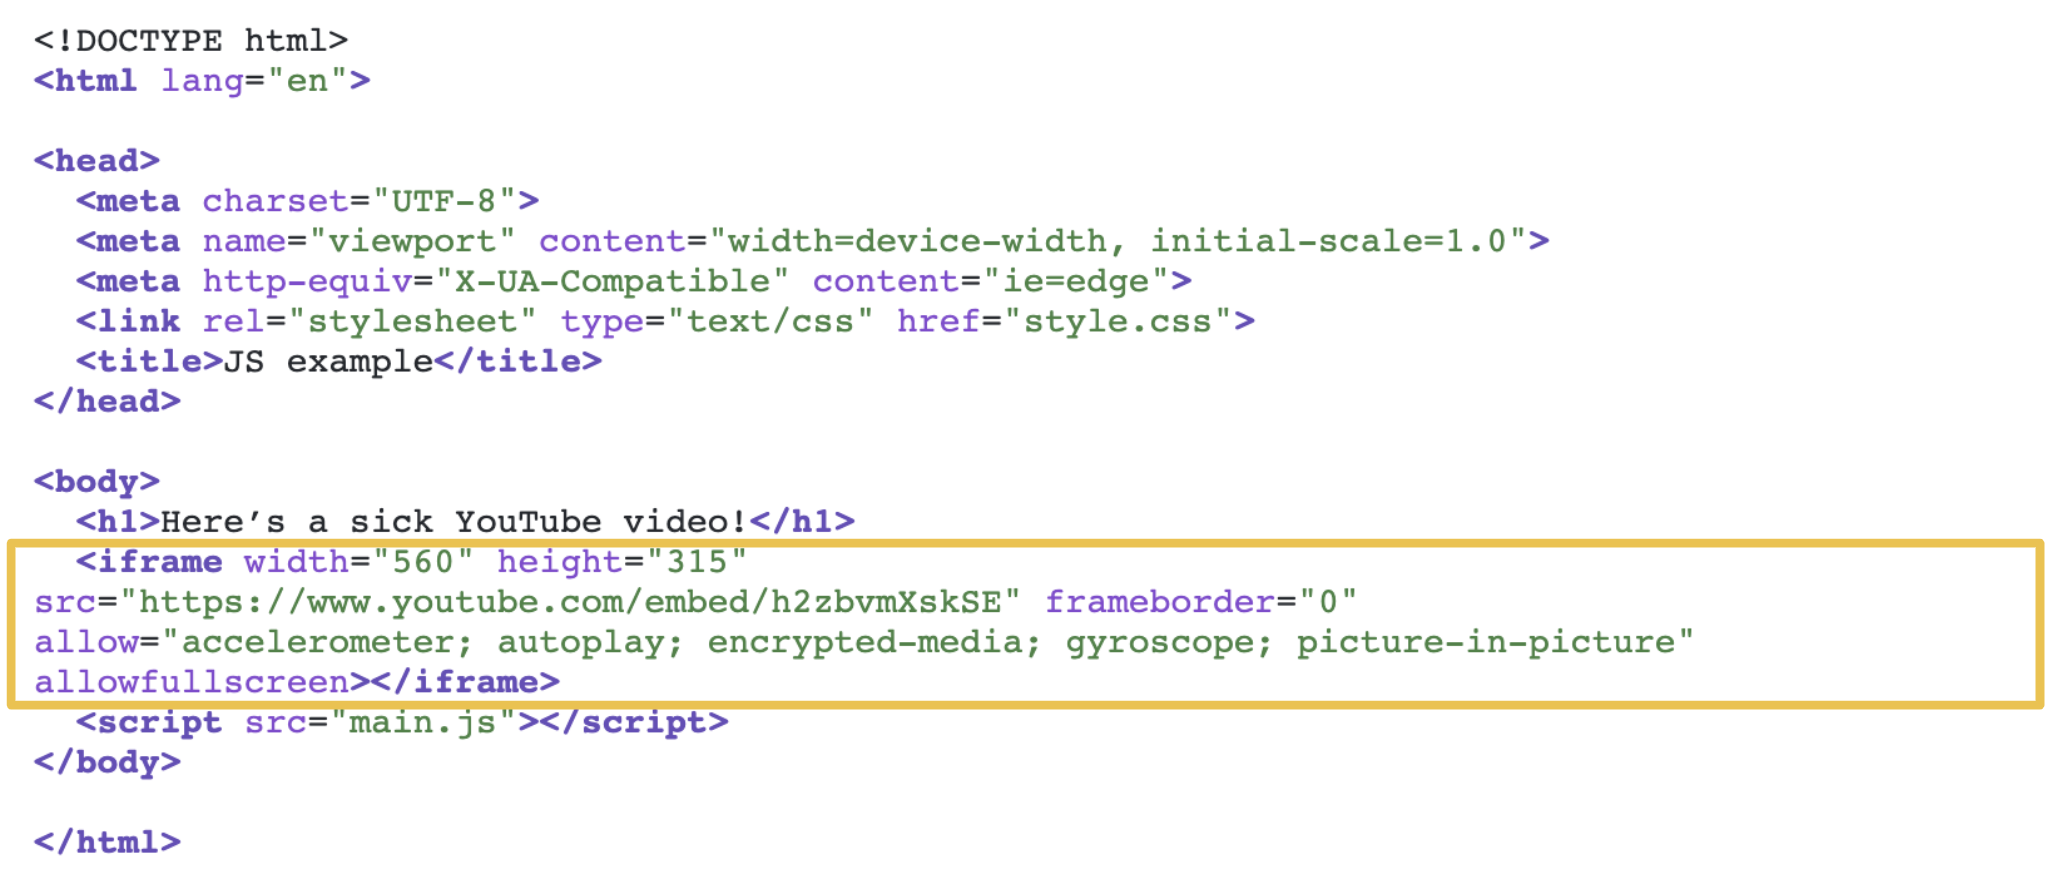
<iframe width="560" height="315" src="https://www.youtube.com/embed/h2zbvmXskSE" frameborder="0" allow="accelerometer; autoplay; encrypted-media; gyroscope; picture-in-picture" allowfullscreen></iframe>
To put this into a webpage, we simply need to paste this code into the HTML, wherever you want the YouTube video to show up. Make sure, as always, to put it in the
<body> section before any
<script> tags.
Here’s an example:

And when we actually put it in, the embed looks something like this:
Embedding in practice
Google Docs, Google Sheets, and Google Slides can all be embedded. Here’s the slides for today’s class as an embed:


